

Clermont’s 623 active single-family listings ask a median of $479,990 this week, and half of them have already cut their price. The Altos Market Action Index reads 32, the same as a month ago, which keeps the city just above the 30 Altos treats as balanced. September’s closings came in at a median of $474,890, so asking prices sit only about 1.1 percent above the closing side. The pressure here is showing up as time rather than discount: 84 days median on the active shelf against 41 days for what actually sold.
The active shelf this week
These are active-listing figures from Altos Research for Clermont, Florida, week of November 6, 2026, single-family homes. They describe asking prices and standing supply, not what buyers paid.
| Altos measure | Clermont, week of November 6, 2026 |
|---|---|
| Median list price | $479,990 |
| Median price of new listings | $474,900 |
| Asking price per square foot | $228 |
| Average days on market | 124 |
| Median days on market | 84 |
| Price decreased | 50% |
| Price increased | 2% |
| Relisted | 5% |
| Inventory (active listings) | 623 |
| Market Action Index | 32, which Altos labels “Slight Seller’s Advantage” |
Half the standing listings have reduced at least once, and the median listing has been active 84 days while the average is 124. A gap that wide between median and average means a tail of listings has been sitting far longer than the midpoint suggests.
The median new listing is priced at $474,900, about 1.1 percent below the median of everything already on the shelf. New sellers are no longer asking a premium over standing inventory, a change from our October report, where new listings in ZIP 34711 came in above the standing median.
The Market Action Index compares the current sales rate against current inventory, and Altos treats 30 as the balanced mark and 35 as a seller’s market. Its narrative this week says the market “remains in a relative stasis in terms of sales to inventory” with prices that “have not been moving higher for several weeks.”
The two rolling medians Altos publishes show the same plateau. Over the four weeks to November 6 the 7-day median held flat at $479,990 against $480,000, while the slower 90-day median fell 2.0 percent from $499,900 to $489,900. Year over year the 7-day median is down 2.0 percent and the 90-day is up 0.2 percent. The slower series is still working off a higher spring, so a seller pricing to those comps is pricing to a level this market has left.
Clermont is three markets, and the Altos city report adds them up
Altos publishes six Clermont reports, one city and five ZIP, and three of the five ZIPs published values this week. The city report is not a separate measurement, which we checked arithmetically: its 623 active listings are exactly 304 in 34711 plus 177 in 34714 plus 142 in 34715, and the weekly counts sum exactly too, at 29 new and 48 absorbed.
| Measure, week of November 6, 2026 | 34711 | 34714 | 34715 |
|---|---|---|---|
| Median list price | $485,499 | $429,000 | $532,495 |
| Asking price per square foot | $228 | $219 | $233 |
| Median days on market | 84 | 77 | 84 |
| Average days on market | 123 | 116 | 136 |
| Price decreased | 48% | 53% | 51% |
| Relisted | 4% | 6% | 7% |
| Inventory (active listings) | 304 | 177 | 142 |
| Market Action Index | 32 | 32 | 30 |
The spread between the cheapest and dearest ZIP is $103,495, or 24.1 percent of the lower figure, so a citywide median is a poor proxy for any one of them. 34711, the core of the city, holds 48.8 percent of the inventory. 34714 runs south toward the Four Corners area and asks the least on both measures. 34715 asks the most and waits the longest, at a 136-day average.
ZIP codes 34712 and 34713 have reports that published no values this week, so nothing from them sits in the table or the city totals. For 34711 and 34715 the report text and the index gauge disagree about last month’s reading, so we publish only this week’s index for those two and take the month-over-month comparison from the city report, where the two agree.
The quartile that is absorbing the market
Altos splits the active file into four price quartiles. In Clermont the useful break is age, and the busiest quartile is not the cheapest one.
| Quartile | Median asking price | Sq. ft. | Median age | Days on market | New / absorbed this week |
|---|---|---|---|---|---|
| Top | $820,000 | 3,178 | 7 years | 87 | 6 / 8 |
| Upper middle | $545,000 | 2,401 | 6 years | 84 | 8 / 11 |
| Lower middle | $435,000 | 1,988 | 18 years | 98 | 6 / 16 |
| Bottom | $349,000 | 1,572 | 25 years | 70 | 9 / 13 |
The two upper quartiles have median ages of 7 and 6 years. The two lower ones are 18 and 25 years. In Clermont, moving up a price band mostly buys newer construction rather than simply more square footage. “Absorbed” means a listing left the active file, by going pending, selling, expiring or being withdrawn, so it is not a count of sales.
The lower middle quartile is the pressure point. It took 16 of the 48 absorbed listings this week, a third of all activity, and it carries the longest median days on market at 98. Heavy turnover and a long wait in the same band means plenty of buyers and plenty of competition, so a 2008-vintage four-bedroom near $435,000 sits in the deepest pool in the city. One week of counts at this size is a snapshot, not a trend.
What September closings actually paid
This section is sold data, from a different source over a different period than everything above.
| Closed single-family sales, Clermont | September 2026 | September 2025 | Change |
|---|---|---|---|
| Closed sales | 155 | 129 | +20.2% |
| Median sold price | $474,890 | $469,000 | +1.3% |
| Median sold price per heated sq. ft. | $220.25 | $216.67 | +1.7% |
| Median cumulative days on market | 41 | 38 | 3 days longer |
| Median sold-to-list price ratio | 0.99 | 0.98 | +1 point |
Based on information from Stellar MLS and sourced by MVP Home Group, Real Broker LLC for the period September 1, 2026 through September 30, 2026 (and September 1, 2025 through September 30, 2025), for Single Family Residence in Clermont, Lake County, Florida. This information may or may not include all listed expired, withdrawn, pending or sold properties of one or more members of Stellar MLS. The MLS city field covers ZIP codes 34711, 34714 and 34715, so it matches the three reporting Altos ZIPs above.
Clermont is the only city in our September export where sales volume, median price and median price per heated square foot all moved up together. Those last two rising by similar amounts, 1.3 and 1.7 percent, is what a stable market looks like. When they diverge the usual explanation is a change in what sold rather than in value, and on 155 sales that is not the case here.
For statewide context, Florida Realtors reported a September 2026 single-family median sale price of $415,000, up 1.2 percent year over year, on 20,537 closed sales, down 3.5 percent, with 4.4 months’ supply. Clermont’s sales count moved the opposite way from the state. No county layer is available: the Orlando Regional Realtor Association does not break out Lake County, and Florida Realtors’ county detail is members only.
What this means if you are deciding whether to list
- Price to September’s closings, not to the active shelf. Asking per square foot of $228 sits 3.5 percent above the $220.25 that closed, a wider gap than the 1.1 percent on headline price. The per-foot figure is the one buyers and appraisers will test.
- Find your ZIP before your price. The citywide median blends three markets $103,495 apart. A 34714 seller priced off it is asking above their own submarket; a 34715 seller priced off it is leaving room on the table.
- Treat 50 percent as the base rate for getting the number wrong. Half of Clermont’s standing listings have already reduced, in full view of every buyer watching the ZIP code, and another 5 percent relisted to reset the clock instead.
- Budget 84 days, not 41. The 41-day figure belongs to homes that already sold, meaning the correctly priced ones. The shelf you are joining has a median of 84 days and an average of 124.
- Set your adjustment date before you list. Decide now what happens if there is no offer by day 21 or day 30, so a reduction is a plan rather than a reaction. Our guide on when to reduce your listing price works through that call.
What the same numbers mean for a buyer
With half of 623 listings already reduced and a median 84 days on market, the slack sits in whatever has been exposed longest. The lower middle quartile near $435,000 carries both the most absorption and the longest wait, so expect competition there alongside sellers watching the clock. If square footage is the priority, 34714 asks $219 per square foot against $233 in 34715.
Room is thinner than the active data alone suggests. September closings ran at 99 percent of list price, up a point from a year earlier, on 20.2 percent more sales. The negotiation is on the long-sitting listings, not the new ones.
Frequently asked questions
Is Clermont a buyer’s or a seller’s market in November 2026?
Neither cleanly. The Altos Market Action Index for Clermont was 32 for the week of November 6, 2026, which Altos labels a slight seller’s advantage and which is unchanged from its reading a month earlier. Altos treats 30 as the balanced mark and 35 as a seller’s market, so 32 sits just above balanced.
Does “Clermont” in this report mean the city limits?
No. The active-listing figures are the Altos city report, which this week equals the exact sum of its three reporting ZIP codes, 34711, 34714 and 34715. Those ZIPs extend past the incorporated city into unincorporated Lake County. The closed-sale figures use the MLS mailing-city field, which covers the same three ZIP codes. If your home carries a Clermont mailing address but sits outside the city line, these numbers are still your competition.
Why is the median 84 days on market when September’s sales took 41?
The two counts measure different groups. Median days on market describes homes currently for sale and still waiting. Median cumulative days on market describes homes that already closed, which by definition are the ones a buyer chose. The 43-day difference is the cost of being in the group that has not sold yet.
Where to go from here
To find which ZIP and quartile your home competes in and what it should ask per square foot, start with a home valuation or read how we handle pricing and listing a home. For neighborhood context see our Clermont area page, and for the rest of the corridor on these same measures, Groveland and Mascotte.
To talk through a specific address and timeline, book a strategy session at mvphomegroup.com/nelsoncruz. Active-listing data is from Altos Research, week of November 6, 2026, read from our Clermont market report; closed-sale data is from Stellar MLS as sourced above. This is general market information, not an appraisal or a valuation of any particular property.
Nelson Cruz, P.A.
Founder & CEO
MVP Home Group, Real Broker LLC
Nelson brings nearly two decades in law enforcement to his work in real estate. View Nelson’s profile or contact our team at 407-901-9939 or [email protected].
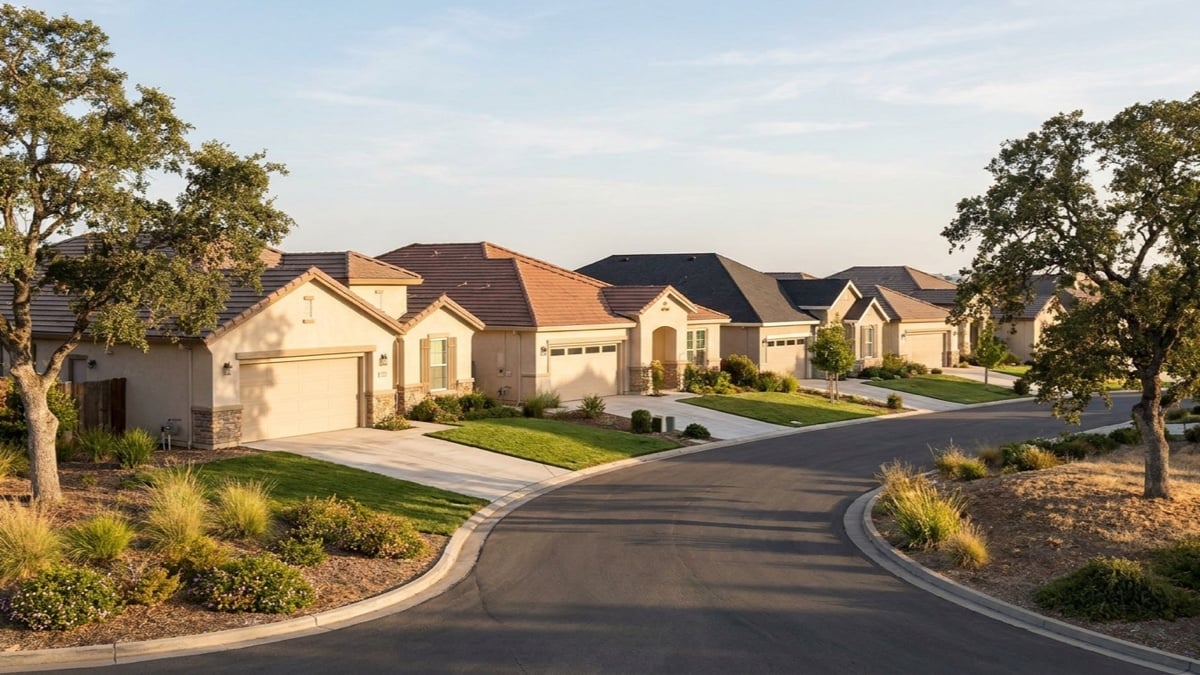
Featured image: AI-generated editorial illustration of a row of finished single-family stucco houses with attached garages stepping downhill along a curving residential street on rolling terrain, with mature oaks and front lawns in late-afternoon light. Not a particular property, street or community.