

Windermere’s active listings and its recent closings describe two different price levels, and the distance between them should drive a seller’s decision this month. For the week of October 31, 2026, Altos Research records a median list price of $1,475,000, while homes newly listed that same week carry a median asking price of $1,095,000. September’s closed single-family sales had a median of $800,000. Sellers who anchor to the standing inventory rather than to what has actually traded end up in the 43 percent of listings already showing a price decrease.
Why these figures cover more than the town of Windermere
We pulled two Altos reports for this snapshot, one built on the city name and one on ZIP code 34786. Every tile and every segment row returned identical values, which means the city report describes the 34786 footprint rather than the municipal limits of the Town of Windermere, a small incorporated area inside a much larger mailing-address zone of unincorporated Orange County.
The closed-sale figures below use the Stellar MLS city field for Windermere, which maps to the same ZIP. One consequence is worth stating plainly: Horizon West is not an MLS city, so its homes fall under the Winter Garden and Windermere mailing cities. Part of what you see here sits in Horizon West, and the Winter Garden report for the same period has the same characteristic for ZIP 34787. Read either one as a municipal boundary and you will draw the wrong conclusion.
Active listings for the week of October 31, 2026
Everything in this table is active-listing data from Altos Research, week of October 31, 2026, for single-family houses. It measures what sellers are asking and how long they have been asking it. None of it is sold data.
| Metric | Value | What it measures |
|---|---|---|
| Median list price | $1,475,000 | Midpoint asking price across all active listings |
| Median price of new listings | $1,095,000 | Midpoint asking price of homes listed this week |
| List price per square foot | $404 | Asking price per square foot, active listings |
| Inventory | 179 | Active single-family listings |
| Median days on market | 98 | Half of active listings have been listed longer |
| Average days on market | 147 | Mean across active listings, pulled up by long-sitting homes |
| Price decreased | 43% | Share of active listings showing a price reduction |
| Price increased | 0% | Share showing a price increase |
| Relisted | 8% | Share that came off the market and returned |
| Market Action Index | 32 | Altos label: Slight Seller’s Advantage |
The Market Action Index deserves a careful reading, because 32 sounds stronger than it is. Altos explains its own scale this way: a reading around 30 indicates a balanced market with just enough supply to meet demand, the low 20s or below is a buyer’s market, and 35 or more points to a seller’s market. Windermere at 32 sits above balanced and below Altos’s own seller’s-market threshold. The report also states that last month’s reading was 32, so the balance has not moved in a month.
The gap between asking and selling prices
Three numbers from that table interact, and together they are the most useful thing here for anyone setting a price.
First, homes listed this week came to market at a median of $1,095,000 against a standing median of $1,475,000. That is $380,000 lower, about 26 percent below the inventory already sitting there. Sellers entering now are pricing well under the homes they are joining.
Second, 43 percent of active listings show a price decrease and zero percent show an increase. Nearly half the market has already moved its number downward, and nothing has moved up.
Third, half of the active listings have been on the market longer than 98 days, and the average of 147 days reveals a tail sitting far longer. A high median asking price alongside those two facts reflects expensive homes that have not traded.
Where the activity sits by price segment
Altos divides the market into four segments of roughly 25 percent each, ordered by price, and reports how many homes entered and left each one. “Absorbed” means a listing is no longer active rather than sold, since withdrawals and expirations leave the active file the same way a contract does.
| Segment median | Sq. ft. | Lot size | Beds / baths | New | Absorbed | DOM |
|---|---|---|---|---|---|---|
| $5,300,000 | 6,896 | 0.5 to 1 acre | 5 / 6 | 1 | 2 | 112 |
| $2,199,000 | 4,282 | 0.5 to 1 acre | 4 / 4.5 | 1 | 3 | 112 |
| $1,090,000 | 3,356 | 0.25 to 0.5 acre | 4 / 3.5 | 3 | 7 | 112 |
| $615,000 | 2,218 | 6,500 to 8,000 sq ft | 4 / 2.5 | 4 | 9 | 73 |
The bottom segment carries the market. It absorbed 9 homes against 4 new listings, and its days-on-market figure of 73 runs 39 days shorter than the identical 112 posted by all three segments above it. Movement thins out as prices rise: the top two segments combined absorbed 5 homes and took in 2.
Across all four segments, 9 homes were listed and 21 left the active file. Applying that weekly rate to the 179 active listings gives roughly eight and a half weeks of supply, which is arithmetic on a single week of Altos counts rather than a stable figure.
What September’s closed sales add
Active listings show intent. Closed sales show what buyers paid. The contrast between them is the point.
| Closed single-family sales | September 2026 | September 2025 |
|---|---|---|
| Closed sales | 35 | 53 |
| Median sold price | $800,000 | $1,050,000 |
| Median sold price per heated sq ft | $303.49 | $299.91 |
| Median days on market (CDOM) | 30 | 48 |
| Median sold-to-list ratio | 0.97 | 0.96 |
The 23.8 percent drop in median sold price reflects a change in what sold rather than a loss of value. Median sold price per heated square foot rose 1.2 percent over the same comparison, and the sale count fell from 53 to 35. Fewer large and expensive homes closed, which pulls the dollar midpoint down while the per-foot rate holds. Anyone quoting the headline decline without the per-foot figure is handing you a misleading number.
Two other lines matter for pricing. September’s closings came in at a median of 97 percent of last list price, a typical concession of about 3 percent off the final asking number. They also went under contract at a median of 30 cumulative days, well below the 98-day median age of what is active now. Correctly priced homes move here, and the standing inventory is where the delay lives.
Closed-sale figures above are based on information from Stellar MLS and sourced by MVP Home Group, Real Broker LLC for the period September 1, 2026 through September 30, 2026 and the period September 1, 2025 through September 30, 2025, for Single Family Residence in Windermere, ZIP 34786, Orange County. This information may or may not include all listed expired, withdrawn, pending or sold properties of one or more members of Stellar MLS.
How to price a Windermere listing this week
- Build your comparison from closed sales on a per-square-foot basis. The $1,475,000 median describes asking prices across an inventory where 43 percent have already been reduced.
- Find your segment in the table above before you look at any citywide number. A 2,200 square foot home on a platted lot and a 6,900 square foot home on three quarters of an acre are in different markets that happen to share a ZIP code.
- Price at the entry point of your segment rather than its ceiling. New listings this week came in about 26 percent under the standing median, which is where sellers are currently choosing to compete.
- Plan the marketing period around 30 days to contract, and decide your reduction trigger before you list, setting both the date and the amount. The 43 percent who have already cut did it after the market told them to, which is the expensive order.
- Hold roughly 3 percent of your asking price as negotiating room, which is what the September sold-to-list median implies, and protect the comp with a closing-cost credit rather than a headline price cut where the buyer’s goal is cash at closing.
What buyers should take from the same data
The leverage is real but narrow. With 43 percent of listings reduced, zero increased and a median active listing age of 98 days, a buyer looking at a home that has been sitting has a genuine case to make. It is strongest in the three upper segments, where days on market sit at 112 and absorption is thin.
The bottom segment behaves differently. Homes around $615,000 absorb at more than twice the rate they are listed and clear in 73 days, so an offer built on seller fatigue will tend to lose there. Below roughly $700,000 in 34786, move quickly and compete on terms. Above $2,000,000, time is on your side.
A caution for both sides: an index of 32 that has not moved in a month describes a market in balance rather than one turning. Nothing here supports a prediction in either direction.
Frequently asked questions
Is the median list price what my Windermere home is worth?
No. The $1,475,000 figure is the midpoint of what sellers are asking across 179 active listings, 43 percent of which have already been reduced. The midpoint of what actually closed in September was $800,000, and the difference reflects both the mix of homes and the gap between asking and trading. Value for a specific home comes from closed comparable sales in its own size and lot segment.
Why did the median sold price fall almost 24 percent from last September?
Because of what sold rather than what homes are worth. Median sold price per heated square foot rose 1.2 percent year over year, from $299.91 to $303.49, while the number of closings fell from 53 to 35. When fewer high-end homes close in a small monthly sample, the dollar midpoint drops even as the per-foot rate holds steady. Use the per-square-foot figure for any conclusion about pricing.
Does an Altos Market Action Index of 32 mean it is a seller’s market?
Not by Altos’s own scale. Altos describes a reading around 30 as balanced, the low 20s or below as a buyer’s market, and 35 or more as a seller’s market. The label attached to 32 on the report is Slight Seller’s Advantage, and the reading was also 32 a month ago. Practically, it means neither side holds a decisive position in the 34786 market right now.
Where to go from here
Dated snapshots are most useful side by side. The Winter Garden report for October 2026 covers the adjacent 34787 footprint, and the Clermont report shows a different price tier in south Lake County over the same weeks.
If you are weighing a listing, start with a valuation for your specific address rather than a citywide median. To work through your segment, your pricing entry point and your reduction plan before anything goes live, book a strategy session with our team.
Nelson Cruz, P.A.
Founder & CEO
MVP Home Group, Real Broker LLC
Nelson brings nearly two decades in law enforcement to his work in real estate. View Nelson’s profile or contact our team at 407-901-9939 or [email protected].
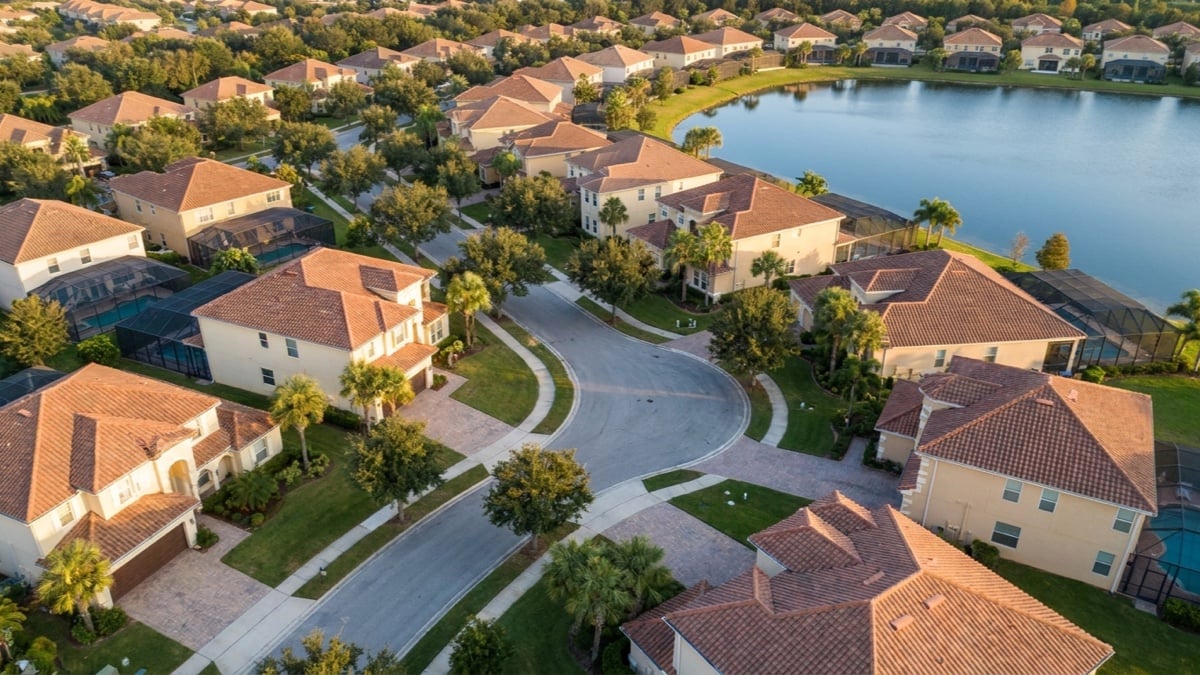
Featured image: AI-generated editorial illustration of an aerial view over a Central Florida residential neighborhood, with large two-story homes under barrel tile roofs, screened pool enclosures, a curving cul-de-sac street with paver driveways, live oaks and cabbage palms between the lots and a retention lake along the far edge. Not a particular property or neighborhood.