

Mount Dora single-family listings carry a median asking price of $467,500 this week, with 256 homes active and a Market Action Index of 31. The number that should drive your pricing decision is this one: new listings are arriving at a median of $488,995, about 4.60 percent above the homes already sitting, and 52 percent of active listings have already cut their price. The pattern is inventory arriving above the going rate and correcting afterward.
Source: Altos Research, week of November 13, 2026, single-family.
New listings arrive above the market, then half of them cut
Mount Dora is the only one of the four Lake County markets in this week’s comparison where fresh inventory asks more than standing inventory. The median new listing at $488,995 sits $21,495 above the $467,500 median for everything already active. At the same time, 52 percent of active listings show a price decrease against 2 percent showing an increase, a ratio of 26 to 1.
Those two readings describe one behavior. Homes are being listed optimistically, they sit, and the price comes down. A seller who prices at the new-listing median is joining the group that is already correcting rather than the group that is selling.
| Mount Dora, single-family | Week of November 13, 2026 |
|---|---|
| Median list price | $467,500 |
| Median price of new listings | $488,995 |
| Asking price per square foot | $224 |
| Average days on market | 116 |
| Median days on market | 81 |
| Listings with a price decrease | 52% |
| Listings with a price increase | 2% |
| Relisted | 5% |
| Inventory | 256 |
| Market Action Index | 31 (Altos label: Slight Seller’s Advantage) |
Average days on market runs 116 against a median of 81. The 35-day gap is the weight of a handful of long-sitting listings pulling the average up past the typical one. Half of what is active has been available 81 days or less.
How Mount Dora compares with its Lake County neighbors
All four of these reports carry the same date and the same property type, so the columns are directly comparable. The contrast in the second column is the point.
| City | Median list | New listings | Per sq ft | Avg DOM | Price cut | Inventory | MAI |
|---|---|---|---|---|---|---|---|
| Mount Dora | $467,500 | $488,995 | $224 | 116 | 52% | 256 | 31 |
| Clermont | $479,990 | $474,900 | $228 | 124 | 50% | 623 | 32 |
| Groveland | $416,499 | $416,167 | $202 | 120 | 47% | 178 | 30 |
| Leesburg | $310,000 | $289,900 | $173 | 131 | 46% | 442 | 30 |
Clermont, Groveland and Leesburg all bring new listings to market at or below their standing medians. Leesburg prices arrivals 6.48 percent under its standing inventory. Mount Dora runs 4.60 percent over. Mount Dora also carries the highest share of price-cut listings of the four.
Two readings cut the other way, and they matter for anyone who has been told the market has stalled. Mount Dora has the lowest average days on market of the four at 116, and the narrowest spread between its average and median days at 35. Leesburg’s spread is 54 days. Mount Dora is the quickest market of the group, and the group is slow.
Every one of these four index readings lands between 30 and 32. Altos publishes its own scale: a reading around 30 indicates a balanced market, low 20s or below is a buyer’s market, and 35 or more points to a seller’s market. Mount Dora at 31 sits one point into balanced territory and four points below the seller’s-market line, whatever the dashboard label on the report says.
One price band is doing most of the clearing
Altos splits the market into four segments of roughly 25 percent each, ordered by price, and reports how many listings entered each segment and how many left it during the period. Across all four Mount Dora segments, 20 listings came on and 17 went off.
| Segment median | Size | Age | New | Absorbed | DOM |
|---|---|---|---|---|---|
| $736,945 | 3,050 sq ft | 19 yrs | 5 | 3 | 112 |
| $528,935 | 2,420 sq ft | 9 yrs | 7 | 2 | 101 |
| $425,655 | 1,961 sq ft | 12 yrs | 2 | 7 | 63 |
| $335,000 | 1,505 sq ft | 32 yrs | 6 | 5 | 73 |
The $425,655 segment took 7 of the 17 absorptions, 41.2 percent of all clearing activity, while receiving only 2 of the 20 new listings. It also carries the shortest days on market in the table at 63. Supply is thin there and demand is finding it.
Group the table in halves and the imbalance is plain. The two upper segments took 12 of 20 new listings, 60.0 percent, and accounted for 5 of 17 absorptions, 29.4 percent. The two lower segments took 8 new listings and accounted for 12 absorptions, 70.6 percent. Inventory is arriving at the top of the market and leaving from the bottom.
One caution: “absorbed” means a listing left the active set, which includes expired, withdrawn and cancelled listings as well as closings. None of these figures are sold prices.
Why the cheapest quarter is not the cheapest per square foot
Divide each segment’s median price by its median size and the bottom segment comes out at about $222.59 per square foot, above the $217.06 of the segment directly above it and the $218.57 above that. The $335,000 band is cheaper because its homes are smaller and older, 1,505 square feet and 32 years against 1,961 square feet and 12 years one step up, a difference of 456 square feet and 20 years. Buyers at the entry level in Mount Dora are not getting a discount on the square foot. They are buying fewer of them, in older houses.
If you are listing in Mount Dora this winter
- Price against the $467,500 standing median, not the $488,995 new-listing median. The arrivals figure reflects what sellers are hoping for. The 52 percent price-cut share reflects what happens next.
- Treat 81 days as the realistic planning number, with the understanding that the 116-day average exists because some listings sit far longer. If your closing is tied to another purchase, build the calendar on the median and keep room past it.
- Know which segment your home lands in before you set a number. A 1,900 to 2,000 square foot home near $425,000 is sitting in the one band where supply is thin and days on market are shortest. The same house priced into the band above joins a group with 101 days and three and a half times the arrivals.
- Get the condition work done before the listing goes live, not after the first cut. A price reduction is public and permanent in the listing history. Downtown sellers should also confirm what exterior work needs city sign-off, because changes inside the historic district require approval and that approval takes calendar time.
- Start from a real valuation. A citywide median covers 256 homes spanning more than $400,000 between the bottom and top segment medians. Ours is a free home valuation built on your home’s segment, not the city’s midpoint.
If you are buying in Mount Dora right now
A market where 52 percent of listings have cut price and 2 percent have raised it gives you room to work, and the room is largest on the listings that have been sitting. The two upper segments carry 112 and 101 days on market with the heaviest flow of new competition, which is where a seller is most likely to have already moved once and be willing to move again.
Near $425,000 the picture reverses. That band is clearing fastest at 63 days with only two new listings against seven absorptions, so a well-priced home there will not wait for a slow offer. Decide in advance which of those two situations you are shopping in.
Common questions about these numbers
Is Mount Dora a buyer’s market or a seller’s market right now?
By Altos’s published scale it is balanced. The Market Action Index reads 31, and Altos states that a reading around 30 indicates a balanced market with just enough supply to meet demand, while 35 or more points to a seller’s market. Clermont at 32, Groveland at 30 and Leesburg at 30 all sit in the same band, so this is a Lake County condition rather than something specific to Mount Dora.
Do these figures tell me what homes actually sold for?
No. Every number in this report describes homes currently listed for sale: what sellers are asking, how long listings have been active, and how many have changed their price. Asking prices and sold prices are different measurements. We did not publish a closed-sale layer for Mount Dora this month because our Stellar MLS export does not cover the city.
Why does this report not show a year-over-year price change?
Because we could not read one as an actual observation. The price history on the underlying report is drawn as a chart without published values for the individual weeks, and estimating a figure from the shape of a line would mean publishing a number we did not read. We would rather tell you the comparison is unavailable than print an approximation as though it were measured.
About this data
Figures are from Altos Research, week of November 13, 2026, covering single-family homes in Mount Dora, Florida. Altos reports active listings, so medians here are asking prices and “absorbed” means a listing left the active set rather than that it sold. Mount Dora’s Altos city report and its ZIP 32757 report return the same values; ZIP 32756 published no data this week, so there is no sub-area breakdown to show. The month-over-month index comparison printed in the source report conflicts with its own gauge and has been left out. You can follow the underlying numbers on our Mount Dora market report, which updates weekly.
Numbers move every week. Pricing decisions do not have to. If you want to know which segment your Mount Dora home sits in and what that means for the number you put on it, book a strategy session at mvphomegroup.com/nelsoncruz.
Nelson Cruz, P.A.
Founder & CEO
MVP Home Group, Real Broker LLC
Nelson brings nearly two decades in law enforcement to his work in real estate. View Nelson’s profile or contact our team at 407-901-9939 or [email protected].
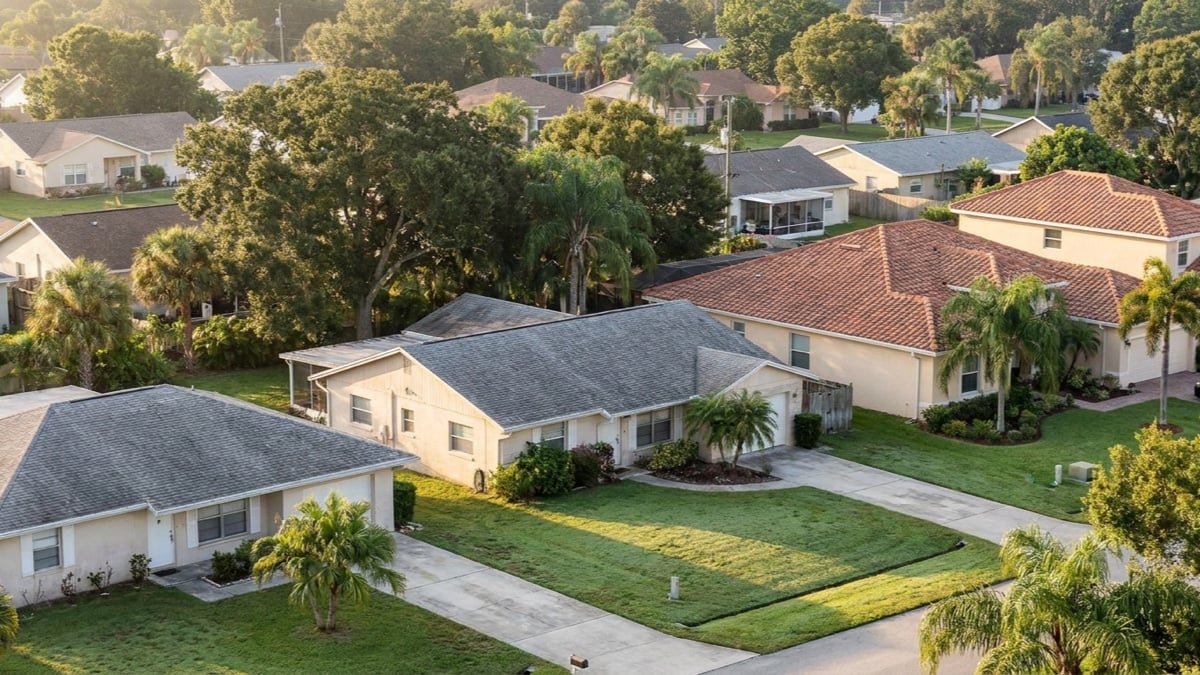
Featured image: AI-generated editorial illustration of an elevated view across a single-family neighborhood with shingle and barrel tile roofs, oak and palm trees, concrete driveways and front lawns in morning light. It does not depict a particular property.