

Mascotte’s 41 active single-family listings ask a median of $339,900 this week, and single-family homes that actually closed in September sold at a median of $335,000. On the headline number the asking side is already within about 1.5 percent of the closing side. Measured per square foot the picture changes: active listings ask $183 while September sales closed at $164.23. That is where the pressure shows, and it is why 41 percent of the standing inventory has already cut its price while none has been relisted.
What the active listings show this week
These are active-listing figures from Altos Research for the week of November 6, 2026, single-family homes. They describe what sellers are asking, not what buyers paid. Closed sales appear further down and are kept separate.
| Altos measure | Mascotte, week of November 6, 2026 |
|---|---|
| Median list price | $339,900 |
| Median price of new listings | $490,000 |
| Asking price per square foot | $183 |
| Average days on market | 93 |
| Median days on market | 56 |
| Price decreased | 41% |
| Price increased | 0% |
| Relisted | 0% |
| Inventory (active listings) | 41 |
| Market Action Index | 34, which Altos labels “Slight Seller’s Advantage” |
Altos describes inventory as having increased to 41 but prints no prior week’s count, so we give the current number and leave the change where Altos put it.
Two rows deserve attention together. Price decreased sits at 41 percent, meaning roughly four in ten standing listings have already reduced the asking price at least once. Relisted sits at 0 percent, meaning nobody has pulled a listing and brought it back as new to reset its days on market. Sellers here are adjusting in public rather than hiding the clock.
The Market Action Index is Altos’s own measure of sales rate against inventory, and Altos treats 30 as the balanced mark. At 34, Mascotte sits above it. The report’s narrative and its gauge disagree about last month’s reading, so we publish only this week’s value and Altos’s label for it.
One caution on scale. Across the whole city this week Altos counts 2 new listings and 1 absorbed. “Absorbed” means a listing left the active file, not that it sold, and three data points cannot carry a trend.
Why “Mascotte” in this report means ZIP code 34753
Altos publishes exactly two Mascotte reports: a city report and a report for ZIP code 34753. We pulled both and compared them line by line. The market profile table and the quartile segment table are identical, character for character, and only the label differs.
So the city report measures the 34753 footprint, which extends past the incorporated city limits into unincorporated Lake County. If your home sits outside the city line but carries a Mascotte mailing address, these numbers are your competition. It is the same single-ZIP pattern we found in Montverde and ZIP 34756, unlike larger cities whose Altos report aggregates several ZIP codes.
Age, not price, is what separates the quartiles
Altos splits the active file into four price quartiles. Here the sharpest break between them is not price or size. It is how old the houses are.
| Quartile | Median asking price | Sq. ft. | Median age | Days on market | New / absorbed this week |
|---|---|---|---|---|---|
| Top | $429,000 | 2,242 | 2 years | 56 | 1 / 0 |
| Upper | $350,000 | 2,153 | 5 years | 35 | 1 / 0 |
| Lower | $313,750 | 1,766 | 6 years | 52 | 0 / 0 |
| Bottom | $279,000 | 1,252 | 27 years | 84 | 0 / 1 |
The top three quartiles have median ages of 2, 5 and 6 years. The bottom quartile’s median age is 27 years and its homes run about 1,000 square feet smaller. Lot sizes barely move across the four groups: three of the four sit in the quarter-acre to half-acre band, and the top quartile is on slightly smaller ground between 8,000 and 10,000 square feet.
So a Mascotte seller is not competing against “the $340,000 market.” A 2019 four-bedroom competes in a pool of near-new construction where the median listing moves in 35 to 52 days. A 1998 three-bedroom competes in the bottom quartile, where the median listing has been sitting 84 days. Those are different negotiations even though only one quartile separates them on price.
The median price of new listings is $490,000, about 44 percent above the $339,900 median of the standing file. New supply arriving here is asking well above what is already on the shelf.
What actually closed in September
Everything above is asking price. This section is sold data from a different source covering a different period, so the two are not one series.
| Closed single-family sales, Mascotte | September 2026 | September 2025 | Change |
|---|---|---|---|
| Closed sales | 9 | 16 | -43.8% |
| Median sold price | $335,000 | $363,995 | -8.0% |
| Median sold price per heated sq. ft. | $164.23 | $205.88 | -20.2% |
| Median cumulative days on market | 92 | 53 | 39 days longer |
| Median sold-to-list price ratio | 1.00 | 1.00 | unchanged |
Nine sales is a small sample, flagged as such in our own data, and it cannot settle Mascotte’s price level. What it can support is the shape of the gap between two measures, because both were computed the same way in both years.
Median price per square foot fell 20.2 percent while the median sold price fell 8.0 percent. When the per-square-foot figure drops much harder than the headline price, the usual explanation is that the homes that sold this year were larger, not that every house lost a fifth of its value. Treat it as a mix shift until a larger sample says otherwise.
The more reliable pair is the last two rows. Sellers who closed in September got their asking price, with a median sold-to-list ratio of 1.00 in both years, and they waited 92 days to get it against 53 days a year earlier. In Mascotte the cost of a list price that is too high is showing up as time rather than as a discount at the closing table.
Based on information from Stellar MLS and sourced by MVP Home Group, Real Broker LLC for the period September 1, 2026 through September 30, 2026 (and September 1, 2025 through September 30, 2025), for Single Family Residence in Mascotte, Lake County, Florida. This information may or may not include all listed expired, withdrawn, pending or sold properties of one or more members of Stellar MLS.
How Mascotte compares with the rest of Lake County
Using the same export, property type and definitions across every city, Mascotte is the least expensive single-family market in Lake County on both measures we track.
| Lake County city | Closed sales, Sept 2026 | Median sold price | Median price per heated sq. ft. |
|---|---|---|---|
| Mascotte | 9 | $335,000 | $164.23 |
| Groveland | 47 | $400,000 | $195.64 |
| Clermont | 155 | $474,890 | $220.25 |
| Minneola | 34 | $559,360 | $238.00 |
| Montverde | 7 | $800,000 | $226.87 |
Mascotte’s median sold price ran 16.2 percent below neighboring Groveland and 29.5 percent below Clermont. Per heated square foot the gaps are 16.1 percent and 25.4 percent.
For statewide context, Florida Realtors reported a September 2026 single-family median sale price of $415,000, up 1.2 percent year over year, on 20,537 closed sales, down 3.5 percent. Statewide months supply of inventory was 4.4 months and the statewide median time to contract was 47 days. Mascotte’s median sold price moved the other way from the state figure. No county layer is available here: the Orlando Regional Realtor Association does not break out Lake County, and Florida Realtors’ county detail is restricted to members.
What the numbers mean if you are deciding whether to list
- Set the per-square-foot number first, then the price. The standing file asks $183 per square foot; September sales closed at $164.23. That is the widest asking-to-closing gap in this report, far wider than the 1.5 percent gap on headline price. Price off the closed figure for your size and age band, not off what the active listings ask.
- Know which quartile you are in before you pick a number. A house over roughly twenty years old and under about 1,400 square feet sits in the bottom quartile, where the median listing has been active 84 days. Under ten years old, you compete in the three quartiles moving in 35 to 56 days.
- Treat 41 percent as the base rate for getting it wrong. Four in ten standing listings have already reduced, and nobody has relisted to reset the clock. A price cut here happens in full view of every buyer watching the ZIP code.
- Budget time, not discount. September’s median sold-to-list ratio was 1.00 against a median 92 days on market. Sellers are holding price and paying for it in months. Decide up front which you would rather spend.
- Do not price against the new-listing median. The $490,000 figure reflects what is arriving and sits about 44 percent above the standing median. It is not a benchmark for an existing home.
What the same numbers mean for a buyer
Forty-one active listings is a small shelf. The bottom quartile is where the observable slack is: a median 84 days on market and the only absorbed listing in the city this week. Those sellers have had the longest exposure to the 41 percent discount rate and the fewest comparable competitors.
The top three quartiles are near-new construction at median ages of 2, 5 and 6 years, turning in 35 to 56 days. Expect less room there, and expect to be compared against new supply asking a median of $490,000.
On price per square foot, Mascotte closed September at $164.23 against $195.64 in Groveland and $220.25 in Clermont. If square footage is what you are buying, that difference is the reason to look here.
Frequently asked questions
Does Mascotte in this report mean the city limits or the ZIP code?
The active-listing figures describe ZIP code 34753. Altos publishes a Mascotte city report and a 34753 ZIP report, and we compared them in full this week: the market profile and the quartile tables are identical. The ZIP extends beyond the incorporated city into unincorporated Lake County. The closed-sale figures use the MLS mailing-city field, which follows the same postal geography rather than the municipal boundary.
Altos calls this a slight seller’s advantage, so why did September sales take 92 days?
They measure different things over different periods. The Market Action Index compares the current rate of sales against current inventory, and at 34 it sits above the 30 Altos treats as balanced. Median cumulative days on market counts backward, over how long the homes that closed in September had been for sale. The active file shows the same split: median days on market is 56 while the average is 93, so a group of long-sitting listings is pulling the average above the midpoint.
Why did price per square foot fall 20 percent when the median sold price only fell 8 percent?
Because the two measures respond differently to a change in what sold. With nine sales in the month, a handful of larger homes closing at moderate prices will drag the per-square-foot median down much faster than the headline median. That is a mix shift in the sample, not evidence that Mascotte homes lost a fifth of their value. The sold-to-list ratio holding at 1.00 in both years argues the same way.
Where to go from here
If you own in Mascotte and want to know which quartile your home competes in and what it should ask per square foot, start with a home valuation, or read how we approach pricing and listing a home. To compare against the rest of the corridor, our reports on Clermont and Minneola use the same measures. If you are weighing a vacant lot rather than a finished home in this part of Lake County, the land rules are a separate question we covered in what changes when you buy land near Groveland.
To talk through a specific address and timeline, book a strategy session at mvphomegroup.com/nelsoncruz. We will put your home against the quartile it competes in and the closed sales that set its ceiling. Active-listing data is from Altos Research, week of November 6, 2026; closed-sale data is from Stellar MLS as sourced above. This is general market information, not an appraisal or a valuation of any particular property.
Nelson Cruz, P.A.
Founder & CEO
MVP Home Group, Real Broker LLC
Nelson brings nearly two decades in law enforcement to his work in real estate. View Nelson’s profile or contact our team at 407-901-9939 or [email protected].
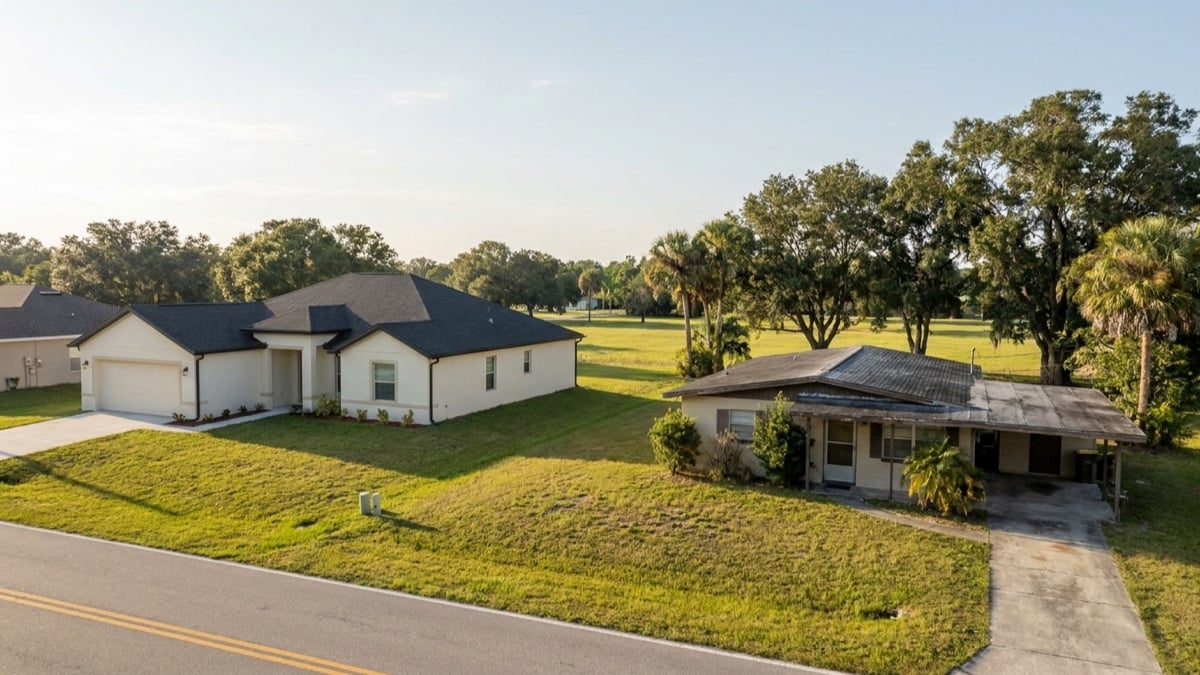
Featured image: AI-generated editorial illustration of a newly built one-story stucco house with an attached garage standing beside an older, smaller house with a weathered low-pitched roof and a carport, both on wide grassy lots along a two-lane residential road with open field and oaks behind. Not a particular property, street or community.