

Windermere’s weekly median asking price rose 6.9 percent in two weeks, from $1,395,000 on October 23 to $1,491,500 on November 6. The 90-day median behind it did not move at all: it has sat between $1,390,000 and $1,396,000 for twelve straight weeks. The gap is the mix of what got listed. This week’s new listings carried a median of $2,447,500, which is 64 percent above the standing inventory. If you price off the weekly headline, you are pricing off somebody else’s house.
Two numbers that disagree, and which one to use
Altos Research publishes two medians for the same market. The 7-day median is the midpoint of asking prices in one week. The 90-day median spans the trailing quarter, so a handful of unusual listings cannot move it much. For Windermere, week of November 10, 2026, the two have separated:
| Week ending | 7-day median | 90-day median |
|---|---|---|
| August 21, 2026 | $1,299,900 | $1,396,000 |
| September 18, 2026 | $1,450,000 | $1,390,000 |
| October 16, 2026 | $1,396,000 | $1,395,000 |
| October 23, 2026 | $1,395,000 | $1,395,000 |
| October 30, 2026 | $1,475,000 | $1,395,000 |
| November 6, 2026 | $1,491,500 | $1,396,000 |
Across those twelve weeks the 90-day median moved inside a $6,000 band, which is 0.43 percent, and finished exactly where it started. Year over year both lines are up: the 90-day by 7.88 percent from $1,294,000, the weekly by 8.24 percent from $1,378,000, both measured against November 7, 2025. The gains are real and they were earned earlier in the year. Over the past quarter, only one of the two lines moved.
What pushed the weekly number
Altos reports the median price of new listings separately, and this week it is $2,447,500 against a standing median list price of $1,491,500, a difference of $956,000. Ten days earlier the same measure read $1,095,000, which was 25.8 percent below the standing inventory rather than 64.1 percent above it. Nothing about the existing inventory changed that fast. What changed is which homes came to market in a given week.
Sample size is the reason to be careful. Altos counted 14 new listings across the four price segments this week against 15 absorbed. A median drawn from roughly fourteen homes in a market this spread out swings hard whenever two or three estates list at once, and it did. Treat the new-listing median as a description of the week’s arrivals, not as a revaluation of your home.
The standing inventory, line by line
These are the active-listing measures for Windermere as of the week of November 10, 2026. They describe homes currently for sale and what they ask. None of them is sold data.
| Metric | Nov 10, 2026 | Oct 31, 2026 | Change |
|---|---|---|---|
| Median list price | $1,491,500 | $1,475,000 | +$16,500 |
| Median price of new listings | $2,447,500 | $1,095,000 | +$1,352,500 |
| List price per square foot | $409 | $404 | +$5 |
| Inventory (active listings) | 180 | 179 | +1 |
| Median days on market | 91 | 98 | -7 days |
| Average days on market | 138 | 147 | -9 days |
| Price decreased | 39% | 43% | -4 points |
| Price increased | 1% | 0% | +1 point |
| Relisted | 2% | 8% | -6 points |
| Market Action Index | 32 | 32 | unchanged |
Source: Altos Research, week of November 10, 2026, single-family homes. October figures as published in our October 2026 Windermere report. “Absorbed” means a listing is no longer active, which is not the same as sold.
Four of those lines eased at once: price cuts, relisted share, median days on market and average days on market all fell. On 180 listings, a 39 percent cut share is roughly 70 homes carrying a reduction, down from about 77. That is a standing file under slightly less pressure than ten days ago, on inventory that grew by exactly one home.
The Market Action Index held at 32. Altos labels that “Slight Seller’s Advantage” and treats 30 as the dividing line between buyer and seller territory, so 32 sits just inside seller territory and nowhere near a hot market. An index flat for a month, paired with a 90-day price line flat for three, is a market holding its position rather than climbing.
The four price segments
Altos splits the active listings into four groups of roughly equal size, ordered by price. In Windermere they separate by size and lot, not by age.
| Segment median | Size | Lot | Age | New | Absorbed | Median DOM |
|---|---|---|---|---|---|---|
| $5,300,000 | 7,099 sq ft | 0.5 to 1 acre | 21 yrs | 5 | 5 | 98 |
| $2,240,000 | 4,290 sq ft | 0.5 to 1 acre | 20 yrs | 5 | 4 | 105 |
| $1,100,000 | 3,390 sq ft | 0.25 to 0.5 acre | 20 yrs | 3 | 2 | 70 |
| $625,000 | 2,224 sq ft | 6,500 to 8,000 sq ft | 19 yrs | 1 | 4 | 77 |
The top segment asks 8.5 times the bottom on 3.2 times the floor area, while median age across all four groups spans two years. Dividing each segment’s median price by its median size gives roughly $747 per square foot at the top against $281 at the bottom, a 2.7 times spread on homes built within a few years of each other. Price here is carried by land and square footage, so a comparable from a different segment tells you very little about your own.
The bottom segment is the one moving. It absorbed four listings against a single new one, the only group that shed inventory on the week, at a median 77 days on market against 98 and 105 in the two segments above it. Demand below $700,000 is clearing faster than supply is replacing it.
What actually closed
Asking prices are not sale prices. The most recent closed-sale data we hold for Windermere covers September, unchanged from our October report because it comes from the same monthly pull.
| Closed single-family sales | September 2026 | September 2025 |
|---|---|---|
| Closed sales | 35 | 53 |
| Median sold price | $800,000 | $1,050,000 |
| Median sold price per heated sq ft | $303.49 | $299.91 |
| Median days on market (CDOM) | 30 | 48 |
| Median sold-to-list ratio | 0.97 | 0.96 |
Based on information from Stellar MLS and sourced by MVP Home Group, Real Broker LLC for the period September 1, 2026 through September 30, 2026 (and September 1, 2025 through September 30, 2025), for Single Family Residence in Windermere, Florida. This information may or may not include all listed expired, withdrawn, pending or sold properties of one or more members of Stellar MLS.
The median sold price fell 23.8 percent year over year while the median sold price per heated square foot rose 1.19 percent. Those two facts fit together only one way. On a sample that dropped from 53 sales to 35, the dollar median tracked which homes happened to close, not what a given home is worth. The per-square-foot figure is the read on value, and it held. Homes also closed faster, at a median 30 cumulative days on market against 48, and at 97 percent of list rather than 96 percent.
Do not difference the Altos $409 against the Stellar $303.49. One is asking price per square foot on active listings this week, the other sold price per heated square foot on September closings.
For regional context, the Orlando Regional REALTOR Association reported 1,843 single-family sales in September 2026 at a median of $432,360, against 1,866 sales at $432,241 a year earlier, data stated as of October 8, 2026. ORRA members are primarily, though not exclusively, in Orange and Seminole counties, so it is a backdrop rather than a city figure. We are not quoting that report’s months-of-supply number, because the same page states two different values for the same month.
If you are listing in Windermere this month
- Price against your own segment. With an 8.5 times spread from the bottom group to the top, a citywide median is not a comparable. Find the segment your square footage and lot put you in, then work from closings inside it.
- Ignore the weekly new-listing median. At roughly 14 listings a week it reads far above or far below the standing market depending on who listed, and it did both within ten days.
- Expect roughly three months of exposure. Median days on market across active listings is 91, average 138. September’s closings went under contract at a median 30 cumulative days, which is what correct pricing buys you.
- Decide your reduction before you list. Thirty-nine percent of the active file already shows a cut. Knowing what you will do at day 45 is cheaper than discovering it at day 90.
A note for buyers
Inventory is 180 homes and the index has not moved in a month, so there is no urgency premium to pay. The two upper segments sit at 98 and 105 median days on market with five new listings each, which is where negotiating room lives. The bottom segment is the exception: four listings absorbed against one arrival, so below $700,000 you are competing. Closings are running at about 97 percent of list, so the realistic gap is a few points, not ten.
Questions we are getting
Does this report cover just the Town of Windermere or the wider area?
The wider area. Altos publishes exactly two Windermere reports, a city report and a ZIP 34786 report, and this week they match line for line on every profile measure and every segment row. These figures describe the 34786 footprint, which takes in unincorporated Orange County addresses and part of Horizon West along with homes inside the town limits. The Stellar closed-sale figures use the same ZIP.
Prices are up year over year. Why is the market only slightly in sellers’ favor?
The index measures the rate of sales against inventory, not price. At 32 it sits two points above the 30 line Altos uses to separate buyer and seller territory, unchanged for a month. The year-over-year gain of 7.88 percent on the 90-day line is real, and it was earned earlier in the year. The trailing quarter has been flat.
My neighbor listed far above the median. Should I match it?
Only if your home sits in the same segment. The four segments differ by a factor of 3.2 in floor area and 2.7 in price per square foot while being within two years of each other in age, so a nearby listing can be a poor comparable even on the same street. The 39 percent carrying a reduction is largely homes priced against the wrong group.
Where to go from here
In a market whose 90-day center has not moved since August, the asking price you set on day one decides whether you anchor your segment or join the 39 percent that reduces later. Start with closings inside your own segment and with a home valuation for your address.
If you are weighing a Windermere listing this month, book a strategy session at mvphomegroup.com/nelsoncruz. Nearby markets are in our Winter Garden and Clermont November reports.
Nelson Cruz, P.A.
Founder & CEO
MVP Home Group, Real Broker LLC
Nelson brings nearly two decades in law enforcement to his work in real estate. View Nelson’s profile or contact our team at 407-901-9939 or [email protected].
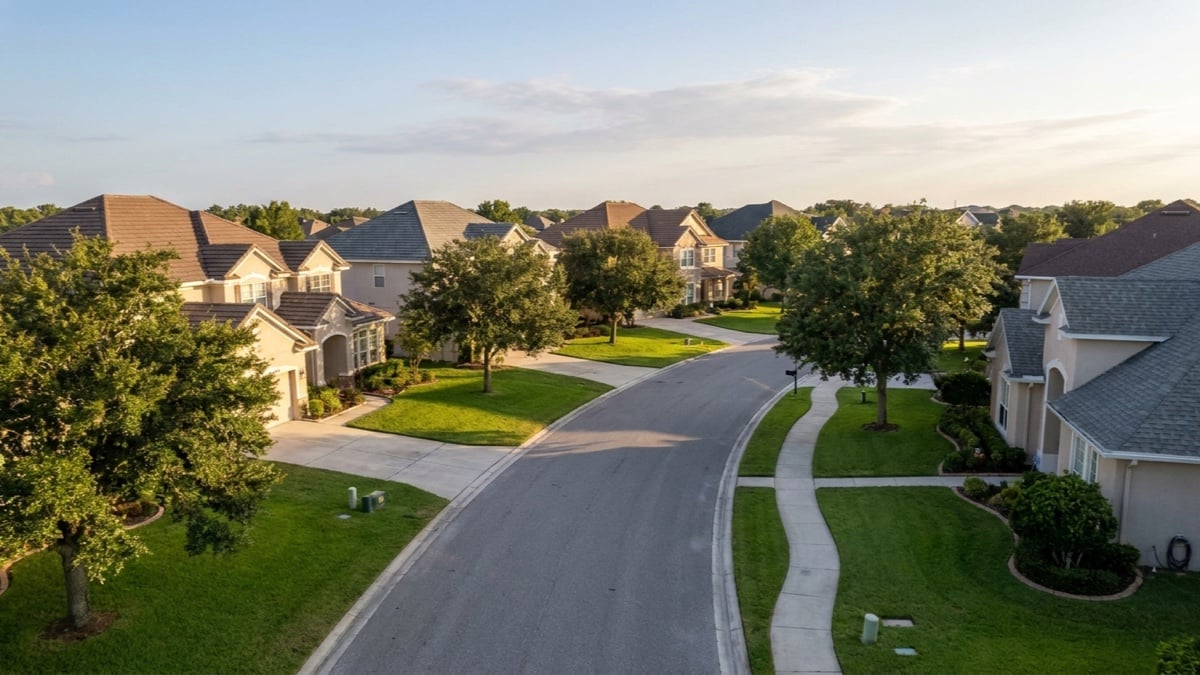
Featured image: AI-generated editorial illustration of a residential street of large single-family homes with tile and shingle roofs, deep lawns, mature oak trees, driveways and a sidewalk. No people and no readable text. Not a particular property, street or neighborhood.