

A Kissimmee seller pricing off the city median list price is working from a number that describes no single part of the city. Altos Research puts the median list price for Kissimmee houses at $426,400 for the week of November 1, 2026, while the six Kissimmee ZIP codes reporting data this week run from $330,000 to $637,000. September’s closed single-family sales had a median of $390,000, which sits 9.33 percent under that city asking figure. Price against the ZIP and against closings, and treat the city number as context only.
What “Kissimmee” covers in these figures
Both data sets here use a mailing-address definition of Kissimmee, not city limits. The Altos report covers houses carrying a Kissimmee, FL label. Our Stellar MLS closed-sale extract covers the MLS city field KISSIMMEE, which resolves to ZIP codes 34741, 34743, 34744, 34746, 34747, 34758 and 34759. The two footprints line up on the same seven ZIPs, so the active and closed figures below are comparable. That area reaches well past downtown Kissimmee and takes in vacation-home areas, the most important caveat on any citywide average here.
Everything labelled Altos below is active-listing data: what sellers are currently asking, never what anything sold for. Everything labelled Stellar is closed-sale data.
Active listings for the week of November 1, 2026
From Nelson’s branded Altos Research report for Kissimmee, property type Houses, week of November 1, 2026.
| Measure (active listings) | Kissimmee, FL |
|---|---|
| Median list price | $426,400 |
| Median price of new listings | $360,000 |
| Listing price per square foot | $201 |
| Average days on market | 157 |
| Median days on market | 98 |
| Listings with a price decrease | 42% |
| Listings with a price increase | 2% |
| Relisted | 5% |
| Inventory (active listings) | 2,014 |
| Market Action Index | 29, “Slight Buyer’s Advantage” |
Altos sets 30 as the dividing line on its Market Action Index. Readings below 30 describe supply outweighing demand, and Altos labels Kissimmee’s 29 a Slight Buyer’s Advantage. The reading was also 29 a month ago, so the balance has not moved, and inventory is holding at roughly 2,014 active listings.
Two figures there deserve a seller’s attention. Forty-two percent of standing listings have already cut their asking price against 2 percent that raised, a ratio of 21 to 1. Sellers coming to market this week are asking a median of $360,000, which is 15.57 percent below the median of listings already sitting there. New sellers are pricing under the standing inventory, and the standing inventory is cutting.
The city median hides a $307,000 spread
Six Kissimmee ZIP codes returned data this week. Altos showed no data for 34742 or 34745 and no values for 34759.
| ZIP | Median list price | vs city median | Average DOM | Market Action Index |
|---|---|---|---|---|
| 34747 | $637,000 | +49.39% | 201 | 26 |
| 34746 | $472,499 | +10.81% | 163 | 27 |
| 34741 | $450,000 | +5.53% | 156 | 30 |
| 34744 | $430,000 | +0.84% | 128 | 31 |
| 34743 | $369,900 | -13.25% | 111 | 35 |
| 34758 | $330,000 | -22.61% | 136 | 30 |
| City figure | $426,400 | n/a | 157 | 29 |
The top ZIP’s median asking price is 1.93 times the bottom ZIP’s, a $307,000 spread, and average days on market runs from 111 to 201. The Market Action Index spans 26 to 35, crossing Altos’s 30 threshold: 34743 at 35 and 34744 at 31 read as a slight seller’s advantage while 34747 at 26 and 34746 at 27 read as a buyer’s advantage. The city figures match none of these ZIPs on price, days on market or index. They average markets that are behaving differently from each other.
34747 is worth separating out. It holds 538 active listings, 26.71 percent of the city’s inventory, and averages 201 days on market, 44 days longer than the city figure. It is also the only reporting Kissimmee ZIP where new sellers are asking more than the standing inventory: a new-listing median of $651,500 against $637,000, 2.28 percent higher. Everywhere else in the city, new sellers are undercutting.
What September’s closed sales add
These are the prices Kissimmee houses actually traded at, from our own Stellar MLS extract.
| Closed single-family sales | Sep 2026 | Sep 2025 | Change |
|---|---|---|---|
| Closed sales | 272 | 265 | +2.64% |
| Median sold price | $390,000 | $395,000 | -1.27% |
| Median sold price per heated sq ft | $197.81 | $193.94 | +2.00% |
| Median cumulative days on market | 46 | 56 | -10 days |
| Median sold-to-list price ratio | 0.99 | 0.98 | +0.01 |
Based on information from Stellar MLS and sourced by MVP Home Group, Real Broker LLC for the period September 1, 2026 through September 30, 2026 (and September 1, 2025 through September 30, 2025), for Single Family Residence in Kissimmee, Osceola County. This information may or may not include all listed expired, withdrawn, pending or sold properties of one or more members of Stellar MLS.
Volume is up slightly on last September while the median sale price is down slightly, which says demand is present at the right number. The sharper signal is the per-square-foot pair: sold price per heated square foot rose 2.00 percent year over year while the median sale price fell, so buyers paid more per foot for somewhat smaller or different houses. Median cumulative days on market dropped 10 days to 46, and the median house sold at 99 percent of list.
The gap between asking and selling
Set the two data sets against each other and the pricing instruction falls out.
- Median asking across standing inventory: $426,400. Median September sale: $390,000. The asking figure sits 9.33 percent above it, a gap of $36,400.
- New listings this week ask a median of $360,000, which is 7.69 percent below September’s median sale.
- Per foot the two sides are close: $201 asked per square foot against $197.81 paid per heated square foot, a difference of 1.61 percent.
That last line matters. Per foot, Kissimmee buyers pay close to what sellers ask, so the headline gap mostly reflects a difference between what is offered and what is bought. It is not a 9 percent discount demand on every house. The listings that fail are the ones whose total price assumes a size or location premium the closings do not support.
Where the activity sits by price segment
Altos splits the market into four segments of roughly 25 percent each, ordered by price. “Absorbed” means a listing left the active market during the period. It does not mean sold: expirations, withdrawals and cancellations count as absorbed too.
| Segment median price | Median size | New | Absorbed | Days on market |
|---|---|---|---|---|
| $750,000 | 3,544 sq ft | 15 | 16 | 133 |
| $494,900 | 2,432 sq ft | 14 | 21 | 105 |
| $377,999 | 1,843 sq ft | 23 | 30 | 80 |
| $279,990 | 1,552 sq ft | 36 | 51 | 84 |
Absorption exceeded new supply in all four quartiles, 118 against 88 citywide, a net reduction of 30 listings. The two lower-priced quartiles accounted for 68.64 percent of absorptions. Days on market climbs with price: the top quartile sits 49 days longer than the bottom. Sellers above roughly $500,000 should plan for a longer marketing period than the city median of 98 days suggests.
How to price a Kissimmee listing this week
- Start from your ZIP. A 34758 owner and a 34747 owner are in markets whose median asking prices differ by $307,000 and whose index readings sit on opposite sides of Altos’s 30 line.
- Anchor to closings, then test per square foot. September’s median was $390,000 at $197.81 per heated square foot. At the 1,843 square feet that is the Altos third-quartile median size, $201 asked per foot comes to $370,443 while $197.81 paid per foot comes to $364,563, a difference of about $5,879. Per-foot math narrows the question quickly. It does not replace a comparable-sales analysis of your actual house.
- Price to avoid joining the 42 percent. Listings that start above the market are the ones cutting later, once the first three weeks of attention are gone. The 0.99 sold-to-list ratio says correctly priced Kissimmee houses are not being beaten down at the table.
- Budget realistic time above $500,000, and decide before listing whether you can hold that long.
- Check what your competition did. With 2,014 active listings and 5 percent relisted, knowing which nearby homes cut and by how much is worth more than any citywide figure here.
What buyers should take from the same data
A Market Action Index of 29 with 42 percent of listings showing a price cut describes real negotiating room, concentrated in the slower, higher-priced parts of the market. The 0.99 median sold-to-list ratio sets expectations: across September’s 272 closings the typical house traded 1 percent under asking, so the room lies in finding listings that are already mispriced. Houses sitting 133 days in the top quartile are better candidates than fresh listings in 34743, where the index reads 35 and average days on market is the city’s shortest at 111. Buyers looking at new construction here should also read our breakdown of CDD assessments on Kissimmee new homes, which add to monthly cost in ways the sale price does not show.
Frequently asked questions
Does the Kissimmee median list price tell me what my house is worth?
No. $426,400 is the midpoint of what sellers are asking across 2,014 active listings spread over seven ZIP codes, including vacation-home areas. It is a measure of supply, not of value, and it sits 9.33 percent above September’s median sale price of $390,000. Your ZIP’s figure and recent closings of comparable houses are the relevant numbers.
What does a Market Action Index of 29 mean for my sale?
Altos treats 30 as the threshold between a buyer’s and a seller’s market and labels Kissimmee’s 29 a Slight Buyer’s Advantage. The reading was also 29 a month ago, so conditions are steady rather than deteriorating. In practice it means your price has to be right at launch, because there is enough competing inventory that buyers can wait you out.
Why is ZIP 34747 so much higher than the rest of Kissimmee?
34747 carries a median list price of $637,000 against the city’s $426,400, holds 538 active listings and averages 201 days on market, 44 days above the city figure. It is also the only reporting Kissimmee ZIP where new sellers are asking above the standing inventory, $651,500 against $637,000. Averaging it together with 34758 at $330,000 produces a citywide number that fits neither.
Where to go from here
These figures describe the market, not your house. For a specific number, start with our home valuation tool, then see what a sale would net you with the home sale calculator. More on this area sits on our Kissimmee page and our Osceola County page, and our previous report covered the Windermere market in October 2026.
If you are deciding whether to list in Kissimmee this quarter, book a strategy session with our team at mvphomegroup.com/nelsoncruz. We pull your ZIP’s Altos report and the closed comparables for your street before talking about a list price, because the citywide figure above is the wrong place to start. This is general market information, not an appraisal or a valuation of any specific property.
Nelson Cruz, P.A.
Founder & CEO
MVP Home Group, Real Broker LLC
Nelson brings nearly two decades in law enforcement to his work in real estate. View Nelson’s profile or contact our team at 407-901-9939 or [email protected].
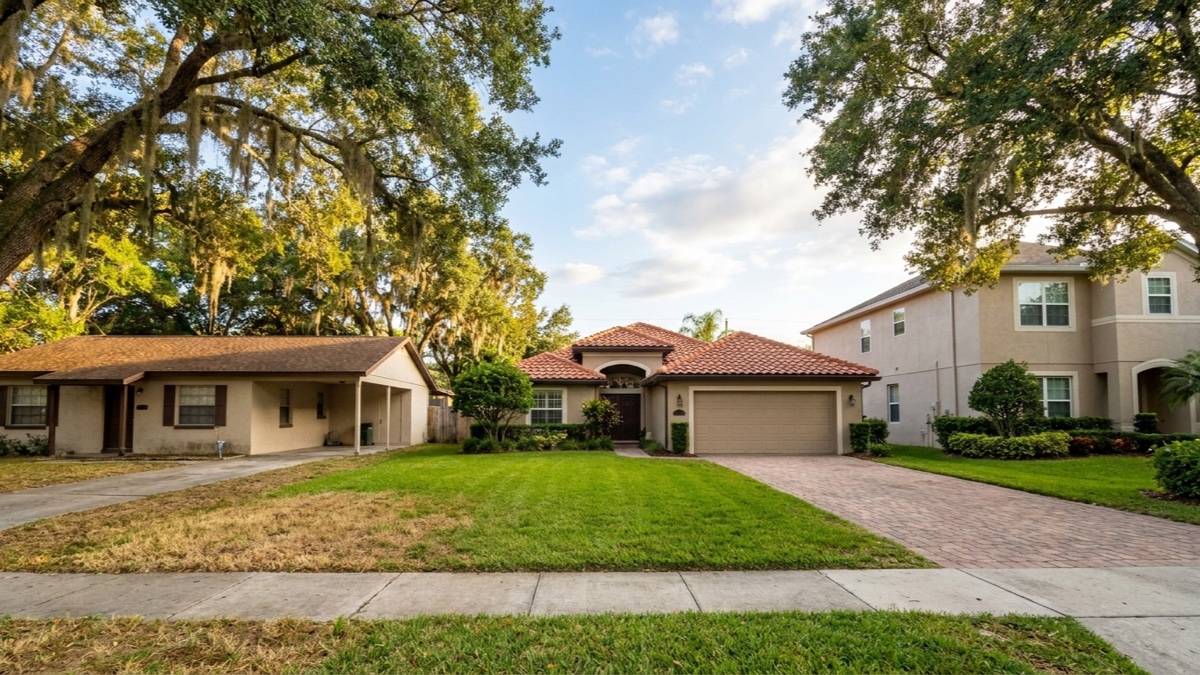
Featured image: AI-generated editorial illustration of three adjacent Central Florida single-family houses of different size and age along one residential street. Not a particular property, street or community.